
Research Glossary.
< | A | B | C | D | | E | F | G | H | I | J | K | L | M | N | O | P | Q | R | S | T | U | V | W | X | Y | Z | >
50th percentile
The middle value when all the values of a variable are arranged in rank order; usually known as the median.
A summary, usually of an article, book or a project report, containing sufficient information for the original to be located.
access
The process involved in gaining entry into an organisation to undertake research.
action research
Research strategy concerned with the management of a change and involving close collaboration between practitioners and researchers. The results should also inform other contexts.
active response rate
The total number of responses divided by the total number in the sample after ineligible and unreachable respondents have been excluded. See ineligible respondent, unreachable respondent.
alternative hypothesis
Testable proposition stating that there is evidence to show a significant difference or relationship between two or more variables. Often referred to as Ha or H1. See also hypothesis, null hypothesis.
analysis
The ability to break down data and to clarify the nature of the component parts and the relationship between them.
analysis of variance
Statistical test to determine the probability (likelihood) that the values of a numerical data variable for three or more independent samples or groups are different. The test assesses the likelihood of any difference between these groups occurring by chance alone.
analytic induction
Analysis of qualitative data that involves the iterative examination of a number of strategically selected cases to identify the cause of a particular phenomenon.
analytic reflection
The process of enquiry often used in the participant as observer role whereby key informants are encouraged to reflect analytically on the processes in which they are involved. This stems from the fact that research subjects know the identity of the researcher and, consequently, the researcher asks questions of those subjects promoting in the research subjects the process of analytic reflection. See also participant as observer.
anonymity
The process of concealing the identity of participants in all documents resulting from the research.
ANOVA
Statistical test to determine the probability (likelihood) that the values of a numerical data variable for three or more independent samples or groups are different. The test assesses the likelihood of any difference between these groups occurring by chance alone.
appendix
A supplement to the project report. It does not normally include material that is essential for the understanding of the report itself, but additional relevant material in which the reader may be interested.
application
The ability to apply certain principles and rules in particular situations.
applied research
Research of direct and immediate relevance to practitioners that addresses issues they see as important and is presented in ways they can understand and act upon.
archival research
Research strategy that analyses administrative records and documents as principal source of data because they are products of day-to-day activities.
asynchronous
Not undertaken in real time, working offline.
attribute variable
Variable that records data about respondents’ characteristics, in other words things they possess.
autocorrelation
The extent to which the value of a variable at a particular time (t) is related to its value at the previous time period (t − 1).
axial coding
The process of recognising relationships between categories in grounded theory.
axiology
A branch of philosophy that studies judgements about the role of values.
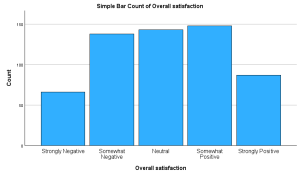
Diagram for showing frequency distributions for a categorical or grouped discrete data variable, which highlights the highest and lowest values.
base period
The period against which index numbers are calculated to facilitate comparisons of trends or changes over time. See also index number.
basic research
Research undertaken purely to understand processes and their outcomes, predominantly in universities as a result of an academic agenda, for which the key consumer is the academic community.
behaviour variable
Variable that records what respondents actually do.
bibliographic details
The information needed to enable readers to find original items consulted or used for a research project. These normally include the author, date of publication, title of article, title of book or journal.
bibliography
Alphabetical list of the bibliographic details for all relevant items consulted and used, including those items not referred to directly in the text. The university will specify the format of these.
blog
Usually refers to a written account of a mixture of what is happening in a person’s life and what is happening on the Internet, published on the Internet.
Boolean logic
System by which the variety of items found in a search based on logical propositions that can be either true or false can be combined, limited or widened.
box plot
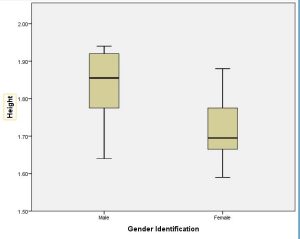
Diagram that provides a pictorial representation of the distribution of the data for a variable and statistics such as median, inter-quartile range, and the highest and lowest values.
brainstorming
Technique that can be used to generate and refine research ideas. It is best undertaken with a group of people.
broker
The person, often in an organisation, who controls research access.
Computer Aided Qualitative Data Analysis Software.
case
Individual element or group member within a sample or population such as an employee.
case study
Research strategy that involves the empirical investigation of a particular contemporary phenomenon within its real-life context, using multiple sources of evidence.
categorical data
Data whose values cannot be measured numerically but can either be classified into sets (categories) or placed in rank order.
categorising
The process of developing categories and subsequently attaching these categories to meaningful units of data. See also unitising, units of data.
category question
Closed question in which the respondent is offered a set of mutually exclusive categories and instructed to select one.
causal relationship
Relationship between two or more variables in which the change (effect) in one variable is caused by the other variable(s).
census
The collection and analysis of data from every possible case or group member in a population.
central limit theorem
The larger the absolute size of a sample, the more closely its distribution will be to the normal distribution. See normal distribution.
central tendency measure
The generic term for statistics that can be used to provide an impression of those values for a variable that are common, middling or average.
chat room
An online forum operating in synchronous mode. See also synchronous.
chi square test
Statistical test to determine the probability (likelihood) that two categorical data variables are associated. A common use is to discover whether there are statistically significant differences between the observed frequencies and the expected frequencies of two variables presented in a cross-tabulation.
classic experiment
Experiment in which two groups are established and members assigned at random to each. See also experiment, experimental group.
closed question
Question that provides a number of alternative answers from which the respondent is instructed to choose.
clustered bar graph/chart
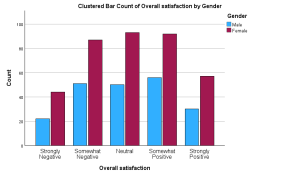
A display of a series of two or more data sets in horizontal or vertical clustered bars. The bars are grouped together, because each data set shares the same axis labels. They are useful in comparing data.
cluster sampling
Probability sampling procedure in which the population is divided into discrete groups or clusters prior to sampling. A random sample (systematic or simple) of these clusters is then drawn.
codebook
Complete list of all the codes used to code data variables.
code of ethics
Statement of principles and procedures for the design and conduct of research. See also privacy, research ethics, research ethics committee.
coding
A process of organising and categorising data to identify themes and patterns. See axial coding, categorising, open coding, selective coding, unitising data.
coefficient alpha
A statistical coefficient used to measure the internal consistency and reliability of a test or survey. It ranges from 0 to 1, where a higher score indicates that a group of questions or items consistently measures the same underlying construct.
coefficient of determination
Number between 0 and +1 that enables the strength of the relationship between a numerical dependent variable and a numerical independent variable to be assessed. The coefficient represents the proportion of the variation in the dependent variable that can be explained statistically by the independent variable. A value of 1 means that all the variation in the dependent variable can be explained statistically by the independent variable. A value of 0 means that none of the variation in the dependent variable can be explained by the independent variable. See also regression analysis.
coefficient of multiple determination
Number between 0 and +1 that enables the strength of the relationship between a numerical dependent variable and two or more numerical independent variables to be assessed. The coefficient represents the proportion of the variation in the dependent variable that can be explained statistically by the independent variables. A value of 1 means that all the variation in the dependent variable can be explained statistically by the independent variables. A value of 0 means that none of the variation in the dependent variable can be explained by the independent variables. See also multiple regression analysis.
coefficient of variation
Statistic that compares the extent of spread of data values around the mean between two or more variables containing numerical data.
cognitive access
The process of gaining access to data from intended participants. This involves participants agreeing to be interviewed or observed, within agreed limits. See also informed consent.
cohort study
Study that collects data from the same cases over time using a series of ‘snapshots’.
collinearity
The extent to which two or more independent variables are correlated with each other. Also termed multicollinearity.
comparative proportional pie chart
Diagram for comparing both proportions and totals for all types of data variables.
compiled data
Data that have been processed, such as through some form of selection or summarising.
complete observer
Observational role in which the researcher does not reveal the purpose of the research activity to those being observed. However, unlike the complete participant role, the researcher does not take part in the activities of the group being studied.
complete participant
Observational role in which the researcher attempts to become a member of the group in which research is being conducted. The true purpose of the research is not revealed to the group members.
computer-aided personal interviewing (CAPI)
Type of interviewing in which the interviewer reads questions from a computer screen and enters the respondent’s answers directly into the computer.
computer-aided telephone interviewing (CATI)
Type of telephone interviewing in which the interviewer reads questions from a computer screen and enters the respondent’s answers directly into the computer.
conclusion
The section of the project report in which judgements are made rather than just facts reported. New material is not normally introduced in the conclusion.
confidentiality
Concern relating to the right of access to the data provided by the participants and, in particular the need to keep these data secret or private.
confounding variable(extraneous variable)
An uncontrolled variable that is unintentionally allowed to vary systematically with the independent variable.
consent
The process of obtaining a participant’s voluntary agreement to take part in a research study. See implied consent, informed consent.
consent form
Written agreement, signed by both parties in which the participant agrees to take part in the research and gives there permission for data to be used in specified ways.
constant
A characteristic or condition that does not vary but is the same for every individual. See variable.
construct
Constructs are abstract ideas that are constructed or adopted to describe and explain the complex and varied elements of human experience and behaviour. Intelligence, drive, motivation, happiness, anxiety, and self-esteem are examples from psychology. All sciences are built on systems of constructs and their interrelations. The natural sciences use constructs such as gravity, temperature, phylogenetic dominance, tectonic pressure, and global warming. Similarly, the behavioral sciences use constructs such as conscientiousness, intelligence, political power, self-esteem, and group culture.
construct validity
Extent to which your measurement questions actually measure the presence of those constructs you intended them to measure.
consultancy report
Abbreviated version of the project report, usually written for a practitioner audience. Normally includes a brief account of objectives, method, findings, conclusions and recommendations.
content validity
Agreement that a question, scale, or measure appears logically to reflect accurately what it was intended to measure.
contextual data
Additional data recorded when collecting primary or secondary data that reveals background information about the setting and the data collection process.
contingency table
Technique for summarising data from two or more variables so that specific values can be read.
continuing access
Gaining agreed research access to an organisation on an incremental basis.
continuous data
Data whose values can theoretically take any value (sometimes within a restricted range) provided they can be measured with sufficient accuracy.
control group
Group in an experiment that, for the sake of comparison, does not receive the intervention n which you are interested. See also experiment, experimental group.
controlled index language
The terms and phrases used by databases to index items within the database. If search terms do not match the controlled index language, the search is likely to be unsuccessful.
controls to allow the testing of hypotheses
Ways of being sure that the outcome being measured (the dependent variable) is caused by the predicted phenomena alone (the independent variable) rather than extraneous unpredicted variables.
convenience sampling
Non-probability sampling procedure in which cases are selected haphazardly on the basis that they are easiest to obtain. See also non-probability sampling.
conversation analysis (CA)
A method for studying social interaction and language by analyzing how people talk and what they say.
corpus analysis
A method of studying language use by examining large collections of texts, or corpora, using computers.
correlation
The extent to which two variables are related to each other. See also correlation coefficient, negative correlation, positive correlation.
correlation coefficient
Number between −1 and +1 representing the strength of the relationship between two ranked or numerical variables. A value of +1 represents a perfect positive correlation. A value of −1 represents a perfect negative correlation. Correlation coefficients between −1 and +1 represent weaker positive and negative correlations, a value of 0 meaning the variables are perfectly independent. See also negative correlation, Pearson’s product moment correlation coefficient, positive correlation, Spearman’s rank correlation coefficient.
coverage
The extent to which a data set covers the population it is intended to cover.
covering letter
Letter accompanying a questionnaire, which explains the purpose of the survey. See also introductory letter.
covert research
Research undertaken where those being researched are not aware of this fact.
Cramer’s V
Statistical test to measure the association between two variables within a table on a scale where 0 represents no association and 1 represents perfect association. Because the value of Cramer’s V is always between 0 and 1, the relative strengths of significant associations between different pairs of variables can be compared.
creative thinking technique
One of a number of techniques for generating and refining research ideas based on non-rational criteria. These may be, for example, biased heavily in favour of the individual’s preferences or the spontaneous ideas of the individual or others. See also brainstorming, Delphi technique, relevance tree.
criterion-related validity
Ability of a statistical test to make accurate predictions.
critical case sampling
A purposive sampling method which focuses on selecting those cases on the basis of making a point dramatically or because they are important. See also purposive sampling.
critical discourse analysis (CDA)
A qualitative research method for analyzing how language is used to reinforce social power, hierarchies, and ideologies.
critical incidence technique
A technique in which respondents are asked to describe in detail a critical incident or number of incidents that is key to the research question. See also critical incident.
critical incident
An activity or event where the consequences were so clear that the respondent has a definite idea regarding the effects.
critical (literature) review
Detailed and justified analysis and commentary of the merits and faults of the literature within a chosen area, which demonstrates familiarity with what is already known about your research topic.
critical realism
The epistemological position that what we experience are sensations, the images of the things in the real world, not the things directly. See also direct realism, realism.
Cronbach’s alpha
See coefficient alpha.
cross-sectional research
The study of a particular phenomenon (or phenomena) at a particular time, i.e. a ‘snapshot’.
cross-tabulation
Technique for summarising data from two or more variables so that specific values can be read.
Facts, opinions and statistics that have been collected together and recorded for reference or for analysis.
data display and analysis
A process for the collection and analysis of qualitative data that involves three concurrent subprocesses of data reduction, data display, and drawing and verifying conclusions.
data matrix
The table format in which data are usually entered into analysis software consisting of rows (cases) and columns (variables).
data requirements table
A table designed to ensure that, when completed, the data collected will enable the research question(s) to be answered and the objectives achieved.
data sampling
The process of only transcribing those sections of an audio-recording that are pertinent to your research, having listened to it repeatedly beforehand.
data saturation
The stage when any additional data collected provides few, if any, new insights.
data set
A collection of measurements or observations.
debriefing
Providing research participants with a retrospective explanation about a research project and its purpose where covert observation has occurred.
deception
Deceiving participants about the nature, purpose or use of research by the researcher(s). See also informed consent, research ethics.
decile
One of 10 sections when data are ranked and divided into 10 groups of equal size.
deductive approach
Research approach involving the testing of a theoretical proposition by the employment of a research strategy specifically designed for the purpose of its testing.
deliberate distortion
Form of bias that occurs when data are recorded inaccurately on purpose. It is most common for secondary data sources such as organisational records.
delivery and collection questionnaire
Data collection technique in which the questionnaire is delivered to each respondent. She or he then reads and answers the same set of questions in a predetermined order without an interviewer being present before the completed questionnaire is collected.
Delphi technique
Technique using a group of people who are either involved or interested in the research topic to generate and select a more specific research idea.
deontological view
View that the ends served by research can never justify research which is unethical.
dependent variable
Variable that changes in response to changes in other variables.
descriptive data
Data whose values cannot be measured numerically but can be distinguished by classifying into sets (categories).
descriptive observation
Observation where the researcher concentrates on observing the physical setting, the key participants and their activities, particular events and their sequence and the attendant processes and emotions involved.
descriptive research
Research for which the purpose is to produce an accurate representation of persons, events or situations.
descriptive statistics
Generic term for statistics that can be used to describe variables.
descripto-explanatory study
A study whose purpose is both descriptive and explanatory where, usually, description is the precursor to explanation.
deviant sampling
A purposive sampling method which focuses on unusual or special cases. See also purposive sampling.
dichotomous data
Descriptive data that are grouped into two categories. See also descriptive data.
direct realism
The epistemological position that what you see is what you get: what we experience through our senses portrays the world accurately. See also critical realism, realism.
discourse analysis
General term covering a variety of approaches to the analysis of language in its own right. It explores how language constructs and simultaneously reproduces and/or changes the social world rather than using it as a means to reveal the social world as a phenomenon.
discrete data
Data whose values are measured in discrete units and therefore can take only one of a finite number of values from a scale that measures changes in this way.
discussion
The section of the project report in which the wider implications of the findings (and conclusions) are considered.
dispersion measures
Generic term for statistics that can be used to provide an impression of how the values for a variable are dispersed around the central tendency.
dissertation
The usual name for research projects undertaken as part of undergraduate and taught masters degrees. Dissertations are usually written for an academic audience.
documentary secondary data
Written documents such as notices, minutes of meetings, diaries, administrative and public records and reports to shareholders as well as non-written documents such as tape and video recordings, pictures, films and television programmes.
Durbin-Watson statistic
Statistical test to measure the extent to which the value of a dependent variable at time t is related to its value at the previous time period, t − 1 (autocorrelation). The statistic ranges in value from zero to four. A value of two indicates no autocorrelation. A value of towards zero indicates positive autocorrelation. A value towards four indicates negative autocorrelation. See also autocorrelation.
A type of external validity referring to the extent to which findings can be generalised from one group to another. See also external validity.
effect size
A statistical concept that measures the strength of the relationship between two variables on a numeric scale. Examples are Pearson’s r correlation, Cohen’s d, η2 – eta squared, Cramer’s φ, Cramer’s V.
electronic interview
An Internet- or intranet-mediated interview conducted through either a chat room, Internet forum, web conferencing or email. See also email interview, chat room, Internet forum.
electronic questionnaire
An internet- or intranet-mediated questionnaire. See also internet-mediated questionnaire, intranet-mediated questionnaire.
element
Individual case or group member within a sample or population such as an employee.
email interview
A series of emails each containing a small number of questions rather than one email containing a series of questions.
epistemology
A branch of philosophy that studies the nature of knowledge and what constitutes acceptable knowledge in a field of study.
ethics
Principles that govern the design, management, and conduct of research. See research ethics, research ethics committees, code of ethics .
ethnography
Research strategy that focuses upon describing and interpreting the social world through first-hand field study.
evaluation
The process of judging materials or methods in terms of internal accuracy and consistency or by comparison with external criteria.
experiential data
Data about the researcher’s perceptions and feelings as the research develops.
experiential meaning
The equivalence of meaning of a word or sentence for different people in their everyday experiences.
experiment
Research strategy that involves the definition of a theoretical hypothesis; the selection of samples of individuals from known populations; the allocation of samples to different experimental conditions; the introduction of planned change on one or more of the variables; and measurement on a small number of variables and control of other variables. Experiments can use either quantitative or qualitative data. See also control group, experimental group.
experimental group
Group in an experiment that receives the intervention in which you are interested. See also control group, experiment.
expert system
Computer-based system that contains much of the knowledge used by experts in a specific field and is designed to assist non-experts in problem solving.
explanation building
Deductive process for analysing qualitative data that involves the iterative examination of a number of strategically selected cases to test a theoretical proposition.
explanatory research
Research that focuses on studying a situation or a problem in order to explain the relationships between variables.
exploratory data analysis (EDA)
Approach to data analysis that emphasises the use of diagrams to explore and understand the data.
exploratory study
Research that aims to seek new insights into phenomena, to ask questions, and to assess the phenomena in a new light.
external researcher
Researcher who wishes to gain access to an organisation for which she or he does not work. See also access, internal researcher.
external validity
The extent to which the research results from a particular study are generalisable to all relevant contexts.
extraneous variable
Variable that might also cause changes in a dependent variable, thereby providing an alternative explanation to your independent variables. See dependent variable, independent variable.
extreme case sampling
A purposive sampling method which focuses on unusual or special cases. See also purposive sampling.
Agreement that a question, scale, or measure appears logically to reflect accurately what it was intended to measure.
fact
A tested and confirmed observation or measurement.
factor analysis
Factor analysis is a statistical technique used to reduce a large number of observed variables into a smaller, unobserved set of “factors”. It discovers latent (hidden) variables that explain patterns of shared variance among the items, making complex datasets easier to analyse and interpret.
filter question
Closed question that identifies those respondents for whom the following question or questions are not applicable, enabling them to skip these questions.
focus group
Group interview, composed of a small number of participants, facilitated by a ‘moderator’, in which the topic is defined clearly and precisely and there is a focus on enabling and recording interactive discussion between participants. See also group interview.
follow-up
Contact made with respondents to thank them for completing and returning a survey and to remind non-respondents to complete and return their surveys.
forced-choice question
Question that provides a number of alternative answers from which the respondent is instructed to choose.
forum
Commonly referred to as web forums, message boards, discussion boards, discussion forums, discussion groups and bulletin boards. Usually only deal with one topic and discourage personal exchanges.
free text searching
Feature that allows searching of an entire database rather than just those terms included in the controlled index language.
frequency count
A measure of how many, for example, people fit into a category. For example, males or female, nationality men under or over 50. See tally.
frequency distribution
A visual representation of the pattern of frequencies of a variable in a dataset.
functionalist paradigm
A philosophical position which is concerned with a rational explanation of behaviours and institutions such as why a particular organisational problem is occurring in terms of the functions they perform.
fundamental research
Research undertaken purely to understand processes and their outcomes, predominantly in universities as a result of an academic agenda, for which the key consumer is the academic community.
Chart that provides a simple visual representation of the tasks or activities that make up a project, each being plotted against a time line.
gatekeeper
The person, often in an organisation, who controls research access.
general focus research question
Question that flows from the research idea and may lead to several more detailed questions or the definition of research objectives.
generalisability
The extent to which the findings of a research study are applicable to other settings.
generalisation
The making of more widely applicable propositions based upon the process of deduction from specific cases.
Goldilocks test
A test to decide whether research questions are either too big, too small, too hot or just right. Those that are too big probably demand too many resources. Questions that are too small are likely to be of insufficient substance, while those that are too hot may be so because of sensitivities that may be aroused as a result of doing the research.
grammatical error
Error of grammar that detracts from the authority of the project report.
grey literature
The first occurrence of a piece of work, including published sources such as government white papers and planning documents and unpublished manuscript sources such as letters, memos and committee minutes.
grounded theory
Research strategy in which theory is developed from data generated by a series of observations or interviews principally involving an inductive approach. See also deductive approach, inductive approach.
group interview
General term to describe all non-standardised interviews conducted with two or more people.
Situation where, in observation studies, the subjects being observed become familiar with the process of observation so that they take it for granted. This is an attempt to overcome ‘observer effect’ or reactivity.
haphazard sampling
Non-probability sampling procedure in which cases are selected haphazardly on the basis that they are easiest to obtain. See also non-probability sampling.
heterogeneous sampling
A purposive sampling method which focuses on obtaining the maximum variation in the cases selected. See also purposive sampling.
heteroscedasticity
Extent to which the data values for the dependent and independent variables have unequal variances. See also variance.
histogram
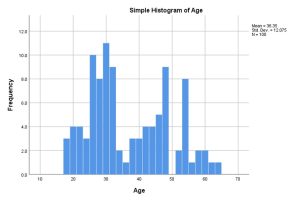
A diagram for showing frequency distributions for a grouped continuous data variable in which the area of each bar represents the frequency of occurrence.
homogeneous sampling
A purposive sampling method which focuses on selecting cases from one particular subgroup in which all the members are similar. See also purposive sampling.
homoscedasticity
Extent to which the data values for the dependent and independent variables have equal variances. See also variance.
hypothesis
Testable proposition stating that there is a significant difference or relationship between two or more variables. Often referred to as H1 See also alternative hypothesis, null hypothesis.
Position achieved when intended participants are fully informed about the nature, purpose and use of research to be undertaken and their role within it, but their consent to participate, is inferred from their participating in the research, such as by responding to a questionnaire. See also informed consent.
independent groups t-test
Statistical test to determine the probability (likelihood) that the values of a numerical data variable for two independent samples or groups are different. The test assesses the likelihood of any difference between these two groups occurring by chance alone.
independent variable
Variable that causes changes to a dependent variable or variables.
in-depth interview
An open-ended, discovery-oriented method to obtain detailed information about a topic from a stakeholder. See also informant interview.
index number
Summary data value calculated from a base period for numerical variables, to facilitate comparisons of trends or changes over time. See also base period.
inductive approach
Research approach involving the development of a theory as a result of the observation of empirical data.
ineligible respondent
Respondent selected for a sample who does not meet the requirements of the research.
inference, statistical
The process of coming to conclusions about the population on the basis of data describing a sample drawn from that population.
inferential statistics
Techniques that allow us to study samples and then make generalisations about the populations from which they were selected.
informant interview
Interview guided by the perceptions of the interviewee.
informant verification
Form of triangulation in which the researcher presents written accounts of, for example, interview notes to informants for them to verify the content. See also triangulation.
informed consent
Position achieved when intended participants are fully informed about the nature, purpose and use of research to be undertaken and their role within it, and where their consent to participate, if provided, is freely given. See also deception, implied consent.
integer
A whole number.
intelligence gathering
The gathering of facts or descriptive research.
inter-library loan
System for borrowing a book or obtaining a copy of a journal article from another library.
internal researcher
Person who conducts research within an organisation for which they work. See also cognitive access, external researcher.
internal validity
Extent to which findings can be attributed to interventions rather than any flaws in your research design.
internet forum
Commonly referred to as web forums, message boards, discussion boards, discussion forums, discussion groups and bulletin boards. Usually only deal with one topic and discourage personal exchanges.
internet-mediated questionnaire
Questionnaire administered electronically using the Internet.
interpolation
The process of calculating a value between two points on the curve of a function from the given points which also lie on the same curve. In other words, it involves the calculation of new values from the already available set of values.
interpretive paradigm
A philosophical position which is concerned with understanding the way we as humans make sense of the world around us.
interpretivism
The epistemological position that advocates the necessity to understand differences between humans in their role as social actors.
inter-quartile range
The difference between the upper and lower quartiles, representing the middle 50% of the data when the data values for a variable have been ranked.
interval data
Numerical data for which the difference or ‘interval’ between any two data values for a particular variable can be stated, but for which the relative difference can not be stated. See also numerical data.
interview schedules
Data collection technique in which an interviewer physically meets the respondent, reads them the same set of questions in a predetermined order, and records his or her response to each.
interviewee bias
Attempt by an interviewee to construct an account that hides some data or when she or he presents herself or himself in a socially desirable role or situation.
interviewer bias
Attempt by an interviewer to introduce bias during the conduct of an interview, or where the appearance or behaviour of the interviewer has the effect of introducing bias in the interviewee’s responses.
interviewer-administered questionnaire
Data collection technique in which an interviewer reads the same set of questions to the respondent in a predetermined order and records his or her responses. See also structured interview, telephone questionnaire.
intranet-mediated questionnaire
Questionnaire administered electronically using an organisation’s intranet.
introduction
The opening to the project report, which gives the reader a clear idea of the central issue of concern of the research, states the research question(s) and research objectives, and explains the research context and the structure of the project report.
introductory letter
Request for research access, addressed to an intended participant or organisational broker/ gatekeeper, stating the purpose of the research, the nature of the help being sought, and the requirements of agreeing to participate. See also covering letter, gatekeeper.
intrusive research methods
Methods that involve direct access to participants, including qualitative interviewing, observation, longitudinal research based on these methods and phenomenologically based approaches to research. See also access, cognitive access.
investigative question
One of a number of questions that need to be answered in order to address satisfactorily each research question and meet each objective.
item analysis
Item analysis is a process which examines responses to individual test items (questions) in order to assess the quality of those items and of the test as a whole. Item analysis is especially valuable in improving items which will be used again in later tests, but it can also be used to eliminate ambiguous or misleading items in a single test administration.
Produced by a professional organisation for its members, often containing articles of a practical nature related to professional needs. Articles in professional journals are usually not refereed. See also refereed academic journal.
judgemental sampling
Selection of sampling techniques in which the chance or probability of each case being selected is not known.
Kendall’s rank correlation coefficient
Statistical test that assesses the strength of the relationship between two ranked data variables, especially where the data for a variable contain tied ranks. For data collected from a sample, there is also a need to calculate the probability of the correlation coefficient having occurred by chance alone.
key word
Basic term that describes the research question(s) and objectives, which can be used in combination to search the tertiary literature.
Kolmogorov-Smirnov test
Statistical test to determine the probability (likelihood) that an observed set of values for each category of a variable differs from a specified distribution. A common use is to discover whether a sample differs significantly from the population from which it was selected.
kurtosis
The pointedness or flatness of a distribution’s shape compared with the normal distribution. If a distribution is pointier or peaked, it is leptokurtic and the kurtosis value is positive. If a distribution is flatter, it is platykurtic and the kurtosis value is negative. See also normal distribution.
A statement based on repeated observations that describes some phenomenon of natural or social life. It provides proof that something happens and how it happens, but not why it happens. See theory.
law of large numbers
Samples of larger absolute size are more likely to be representative of the population from which they are drawn than smaller samples and, in particular, the mean (average) calculated for the sample is more likely to equal the mean for the population, providing the samples are not biased.
lexical meaning
The precise meaning of an individual word.
Likert-style rating scale
Scale that allows the respondent to indicate how strongly she or he agrees or disagrees with a statement.
linearity
Degree to which change in a dependent variable is related to change in one or more independent variables. See also dependent variable, independent variable.
line graph
Diagram for showing trends in longitudinal data for a variable.
list question
Closed question, in which the respondent is offered a list of items and instructed to select those that are appropriate.
literature review
Detailed and justified analysis and commentary of the merits and faults of the literature within a chosen area, which demonstrates familiarity with what is already known about your research topic.
longitudinal study
The study of a particular phenomenon (or phenomena) over an extended period of time.
long-term trend
The overall direction of movement of numerical data values for a single variable after variations have been smoothed out. See also moving average.
lower quartile
The value below which a quarter of the data values lie when the data values for a variable have been ranked.
Abbreviated version of the project report, usually written for a practitioner audience. Normally includes a brief account of objectives, method, findings, conclusions and recommendations.
Mann-Whitney U Test
Statistical test to determine the probability (likelihood) that the values of a ordinal data variable for two independent samples or groups are different. The test assesses the likelihood of any difference between these two groups occurring by chance alone and is often used when the assumptions of the independent samples t-test are not met.
matched-guise technique
A technique which uses recorded voices speaking first in one dialect or language, then in another. Listeners do not know that the speech samples are from the same person, but judge the two guises of the same speaker as two separate speakers.
matrix question
Series of two or more closed questions in which each respondent’s answers are recorded using the same grid.
maximum variation sampling
A purposive sampling method which focuses on obtaining the maximum variation in the cases selected. See also purposive sampling.
mean
The average value calculated by adding up the values of each case for a variable and dividing by the total number of cases.
measurement validity
The extent to which a scale or measuring instrument measures what it is intended to measure.
median
The middle value when all the values of a variable are arranged in rank order; sometimes known as the 50th percentile.
method
The techniques and procedures used to obtain and analyse research data, including for example questionnaires, observation, interviews, and statistical and non-statistical techniques.
methodology
The theory of how research should be undertaken, including the theoretical and philosophical assumptions upon which research is based and the implications of these for the method or methods adopted.
minimal interaction
Process in which the observer tries as much as possible to ‘melt into the background’, having as little interaction as possible with the subjects of the observation. This is an attempt to overcome observer effect. See also observer effect.
mixed-method research
Use of quantitative and qualitative data collection techniques and analysis procedures either at the same time (parallel) or one after the other (sequential) but not in combination.
mixed-methods approach
General term for approach when both quantitative and qualitative data collection techniques and analysis procedures are both used in a research design.
mixed-model research
Combination of quantitative and qualitative data collection techniques and analysis procedures as well as combining quantitative and qualitative approaches in other phases of the research such as research question generation.
mode
The value of a variable that occurs most frequently.
modal group
The most frequently occurring category for data that have been grouped.
moderator
Facilitator of focus group interviews. See also focus group, group interview.
mono method
Use of a single data collection technique and corresponding analysis procedure or procedures.
moving average
Statistical method of smoothing out variations in numerical data recorded for a single variable over time to enable the long-term trend to be seen more clearly. See also long-term trend.
multicollinearity
The extent to which two or more independent variables are correlated with each other. Also termed collinearity.
multi-method
Use of more than one data collection technique and corresponding analysis procedure or procedures.
multi-method quantitative study
Use of more than one quantitative data collection technique and corresponding quantitative analysis procedure or procedures.
multi-method qualitative study
Use of more than one qualitative data collection technique and corresponding qualitative analysis procedure or procedures.
multimodality
The use of multiple modes of communication to create meaning.
multiple bar chart
Diagram for comparing frequency distributions for categorical or grouped discrete or continuous data variables, which highlights the highest and lowest values.
multiple-dichotomy method
Method of data coding using a separate variable for each possible response to an open question or an item in a list question. See also list question, open question.
multiple line graph
Diagram for comparing trends over time between numerical data variables.
multiple methods
Use of more than one data collection technique and analysis procedure or procedures.
multiple regression analysis
The process of calculating a coefficient of multiple determination and regression equation using two or more independent variables and one dependent variable. For data collected from a sample, there is also a need to calculate the probability of the regression coefficient having occurred by chance alone. See also multiple regression coefficient, regression analysis, regression equation.
multiple regression coefficient
Number between 0 and +1 that enables the strength of the relationship between a numerical dependent variable and two or more numerical independent variables to be assessed. The coefficient represents the proportion of the variation in the dependent variable that can be explained statistically by the independent variables. A value of 1 means that all the variation in the dependent variable can be explained statistically by the independent variables. A value of 0 means that none of the variation in the dependent variable can be explained by the independent variables. See also multiple regression analysis.
multiple-response method
Method of data coding using the same number of variables as the maximum number of different responses to an open question or a list question by any one case. See also list question, open question.
multiple-source secondary data
Secondary data created by combining two or more different data sets prior to the data being accessed for the research. These data sets can be based entirely on documentary or on survey data, or can be an amalgam of the two.
multi-stage sampling
Probability sampling procedure that is a development of cluster sampling. It involves taking a series of cluster samples, each of which uses random sampling (systematic, stratified or simple).
The researcher’s detailed account of the research process, written in much the same style as that used by an investigative journalist.
narrative analysis
The collection and analysis of qualitative data that preserves the integrity and narrative value of data collected, thereby avoiding their fragmentation.
naturalistic
Adopting an ethnographic strategy in which the researcher researches the phenomenon within the context in which it occurs.
negative correlation
Relationship between two variables for which, as the values of one variable increase, the values of the other variable decrease. See also correlation coefficient.
negative skew
Distribution of numerical data for a variable in which the majority of the data are found bunched to the right, with a long tail to the left.
netiquette
General operating guidelines for using the Internet, including not sending junk emails.
nominal data
Data whose values cannot be measured numerically but can be distinguished by classifying into sets (categories).
non-maleficence
Avoidance of harm.
non-parametric statistic
Statistic designed to be used when data are not normally distributed. Often used with categorical data. See also categorical data.
non-probability sampling
Selection of sampling techniques in which the chance or probability of each case being selected is not known.
non-random sampling
Selection of sampling techniques in which the chance or probability of each case being selected is not known.
non-response
When the respondent refuses to take part in the research or answer a question.
non-response bias
Bias in findings caused by respondent refusing to take part in the research or answer a question.
non-standardised interview
Wide-ranging category of interview in which the interviewer commences with a set of interview themes but is prepared to vary the order in which questions are asked and to ask new questions in the context of the research situation. See also unstructured interview.
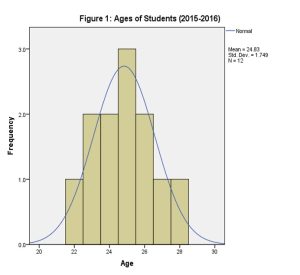
normal distribution
Special form of the symmetric distribution in which the numerical data for a variable can be plotted as a bell-shaped curve.
notebook of ideas
Technique for noting down any interesting research ideas as you think of them.
null hypothesis
Testable proposition stating that there is no significant difference or relationship between two or more variables. Often referred to as H0. See also alternative hypothesis, hypothesis.
numerical data
Data whose values can be measured numerically as quantities.
numeric rating scale
Rating scale that uses numbers as response options to identify and record the respondent’s response. The end response options, and sometimes the middle, are labelled.
An ontological position that asserts that social entities exist in a reality external to, and independent of, social actors concerned with their existence. See also ontology, subjectivism.
objectivity
Avoidance of (conscious) bias and subjective selection during the conduct and reporting of research. In some research philosophies the researcher will consider that interpretation is likely to be related to a set of values and therefore will attempt to recognise and explore this.
observation
The systematic observation, recording, description, analysis and interpretation of people’s behaviour.
observer as participant
Role in which the researcher observes activities without taking part in those activities in the same way as the ‘real’ research subjects. The researcher’s identity as a researcher and research purpose is clear to all concerned. See also participant as observer.
observer bias
This may occur when observers give inaccurate responses in order to distort the results of the research.
observer effect
The impact of being observed on how people act. See also habituation, reactivity.
observer error
Systematic errors made by observers, as a result of tiredness, for example.
one-way analysis of variance
Statistical test to determine the probability (likelihood) that the values of a numerical data variable for three or more independent samples or groups are different. The test assesses the likelihood of any difference between these groups occurring by chance alone.
online questionnaire
Data collection technique in which the questionnaire is delivered via the Internet or an intranet to each respondent. She or he then reads and answers the same set of questions in a predetermined order without an interviewer being present before returning it electronically.
ontology
Branch of philosophy that studies the nature of reality or being. See also axiology, epistemology.
open coding
The process of disaggregating data into units in grounded theory.
open question
Question allowing respondents to give answers in their own way.
operationalisation
The translation of concepts into tangible indicators of their existence.
opinion variable
Variable that records what respondents feel about something or what they think or believe is true or false.
optical mark reader
Data input device that recognises and converts marks on a data collection form such as a questionnaire into data that can be stored on a computer.
ordinal data
Data whose values cannot be measured numerically but which can be placed in a definite order (rank).
Statistical test to determine the probability (likelihood) that the values of two (a pair of) numerical data variables collected for the same cases are different. The test assesses the likelihood of any difference between two variables (each half of the pair) occurring by chance alone.
paradigm
A way of examining social phenomena from which particular understandings of these phenomena can be gained and explanations attempted.
parameter
A value, usually a numerical value, that describes a population. It may be obtained from a single measurement, or it may be derived from a set of measurements from the population. See population, statistic.
parametric statistic
Statistic designed to be used when data are normally distributed. Used with numerical data. See also numerical data.
participant
The person who answers the questions, usually in an interview or group interview.
participant as observer
Observational role in which the researcher takes part in and observes activities in the same way as the ‘real’ research subjects. The researcher’s identity as a researcher and research purpose is clear to all concerned. See also observer as participant.
participant information sheet
Information required by gatekeepers and intended participants in order for informed consent to be given.
participant interview
Interview directed by the questions posed by the interviewer, to which the interviewee responds. See also respondent interview.
participant observation
Observation in which the researcher attempts to participate fully in the lives and activities of the research subjects and thus becomes a member of the subjects’ group(s), organisation(s) or community. See also complete observer, complete participant, observer as participant, participant as observer.
participant researcher
Person who conducts research within an organisation for which they work.
pattern matching
Analysis of qualitative data involving the prediction of a pattern of outcomes based on theoretical propositions to seek to explain a set of findings.
Pearson’s product moment correlation coefficient
Statistical test that assesses the strength of the relationship between two numerical data variables. For data collected from a sample there is also a need to calculate the probability of the correlation coefficient having occurred by chance alone.
percentage component bar chart
Diagram for comparing proportions for all types of data variables.
percentile
One of 100 sections when data are ranked and divided into100 groups of equal size.
personal data
Category of data, defined in law, relating to identified or identifiable persons.
personal entry
Situation where the researcher needs to conduct research within an organisation, rather than rely on the use and completion of self-administered, postal questionnaires or the use of publicly available secondary data. See access.
phenomenology
Research philosophy that sees social phenomena as socially constructed, and is particularly concerned with generating meanings and gaining insights into those phenomena.
Phi (φ)
Statistic to measure association between two variables using a scale between −1 (perfect negative association), through 0 (no association) to +1 (perfect association).
physical access
The initial level of gaining access to an organisation to conduct research. See also cognitive access, continuing access, gatekeeper.
pictogram
Diagram in which a picture or series of pictures are used to represent the data proportionally.
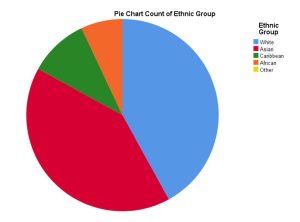
pie chart
Diagram frequently used for showing proportions for a categorical data or a grouped continuous or discrete data variable.
pilot test
Small-scale study to test a questionnaire, interview checklist or observation schedule, to minimise the likelihood of respondents having problems in answering the questions and of data recording problems as well as to allow some assessment of the questions’ validity and the reliability of the data that will be collected.
population
The complete set of cases or group members.
positive correlation
Relationship between two variables for which, as the value of one variable increases, the values of the other variable also increase. See correlation coefficient.
positive skew
Distribution of numerical data for a variable in which the majority of the data are found bunched to the left, with a long tail to the right.
positivism
The epistemological position that advocates working with an observable social reality. The emphasis is on highly structured methodology to facilitate replication, and the end product can be law-like generalisations similar to those produced by the physical and natural scientists.
postal questionnaire
Data collection technique in which the questionnaire is delivered by post to each respondent. She or he then reads and answers the same set of questions in a predetermined order without an interviewer being present before returning it by post.
PowerPoint™
Microsoft computer package that allows the presenter to design overhead slides using text, pictures, photographs etc., which lend a professional appearance.
practitioner-researcher
Role occupied by a researcher when she or he is conducting research in an organisation, often her or his own, while fulfilling her or his normal working role.
pragmatism
A position that argues that the most important determinant of the research philosophy adopted is the research question, arguing that it is possible to work within both positivist and interpretivist positions. It applies a practical approach, integrating different perspectives to help collect and interpret data. See also interpretivism, positivism.
pre-coding
The process of incorporating coding schemes in questions prior to a questionnaire’s administration.
predictive validity
Ability of a statistical test to make accurate predictions.
preliminary search
This way of searching the literature may be a useful way of generating research ideas. It may be based, for example, on lecture notes or course textbooks.
preliminary study
The process by which a research idea is refined in order to turn it into a research project. This may be simply a review of the relevant literature.
pre-set codes
Codes established prior to data collection and often included as part of the data collection form.
pre-survey contact
Contact made with a respondent to advise them of a forthcoming survey in which she or he will be asked to take part.
primary analysis
The original analysis of data in a research study (Glass, 1978, p. 3).
primary data
Data collected specifically for the research project being undertaken. It is original and unprocessed, gathered through methods such as surveys, interviews and observations.
primary literature
The first occurrence of a piece of work, including published sources such as government white papers and planning documents and unpublished manuscript sources such as letters, memos and committee minutes.
primary observation
Observation where the researcher notes what happened or what was said at the time. This is often done by keeping a research diary.
primary research
Following Brown (1988), one of the two ways of finding answers to questions: By conducting one’s own data-based (or in research terms, ’empirical’). investigation, which involves collecting some sort of information (or ‘`data’) and then drawing some conclusion from it. (Dörnyei, 2007, pp. 15-16). See secondary research..
privacy
Primary ethical concern relating to the rights of individuals not to participate in research and to their treatment where they agree to participate. See also research ethics, informed consent.
probability sampling
Selection of sampling techniques in which the chance, or probability, of each case being selected from the population is known and is not zero.
probing questions
Questions used to further explore responses that are of significance to the research topic.
professional journal
Journals produced by a professional organisation for its members, often containing articles of a practical nature related to professional needs. Articles in professional journals are usually not refereed.
project report
The term used to refer generally to dissertations, theses and management reports. See also dissertation, management report, thesis.
pure research
Research undertaken purely to understand processes and their outcomes, predominantly in universities as a result of an academic agenda, for which the key consumer is the academic community.
purposive sampling
Non-probability sampling procedure in which the judgement of the researcher is used to select the cases that make up the sample. This can be done on the basis of extreme cases, heterogeneity (maximum variation), homogeneity (maximum similarity), critical cases, or typical cases.
Non-numerical data or data that have not been quantified.
qualitative interview
Collective term for semi-structured and unstructured interviews aimed at generating qualitative data.
qualitise
Conversion of quantitative data into narrative that can be analysed qualitatively.
quantifiable data
Data whose values can be measured numerically as quantities.
quantitative data
Numerical data or data that have been quantified.
quantitise
Conversion of qualitative data into numerical codes that can be analysed statistically.
quantity question
Closed question in which the respondent’s answer is recorded as a number giving the amount.
quartile
One of four sections when data are ranked and divided into four groups of equal size. See also lower quartile, upper quartile.
questionnaire
General term including all data collection techniques in which each person is asked to respond to the same set of questions in a predetermined order. See also delivery and collection questionnaire, interviewer-administered questionnaire, online questionnaire, postal questionnaire, self-administered questionnaire.
quota sampling
Non-probability sampling procedure that ensures that the sample represents certain characteristics of the population chosen by the researcher.
A perspective which relates to a judgement about the way organisational affairs should be conducted and suggests ways in which these affairs may be conducted in order to make fundamental changes to the normal order of things.
radical humanist paradigm
A position concerned with changing the status quo, of existing social patterns.
radical structuralist paradigm
A position concerned with achieving fundamental change based upon an analysis of underlying structures that cannot be easily observed, for example organisational phenomena as power relationships and patterns of conflict.
random sampling
Probability sampling procedure that ensures that each case in the population has an equal chance of being included in the sample.
range
The difference between the highest and the lowest values for a variable.
ranked data
Data whose values cannot be measured numerically but which can be placed in a definite order (rank).
ranking question
Closed question in which the respondent is offered a list of items and instructed to place them in rank order.
rating question
Closed question in which a scaling device is used to record the respondent’s response. See also Likert-type rating scale, numeric rating scale, semantic differential rating scale.
ratio data
Numerical data for which both the difference or ‘interval’ and relative difference between any two data values for a particular variable can be stated. See also numerical data.
rational thinking technique
One of a number of techniques for generating and refining research ideas based on a systematic approach such as searching the literature or examining past projects.
raw data
Data for which little, if any, data processing has taken place.
reactivity
Reaction by research participants to any research intervention that affects data reliability. See also habituation, observer effect.
realism
The epistemological position that objects exist independently of our knowledge of their existence. See also critical realism, direct realism.
re-coding
The process of grouping or combining a variable’s codes to form a new variable, usually with less detailed categories.
reductionism
The idea that problems as a whole are better understood if they are reduced to the simplest possible elements.
refereed academic journal
Journal in which the articles have been evaluated by academic peers prior to publication to assess their quality and suitability. Not all academic journals are refereed.
references, list of
Bibliographic details of all items referred to directly in the text. The university will specify the format required.
reflexive
Being aware of your own beliefs and judgements during the research process and how they influence the research.
regression analysis
The process of calculating a regression coefficient and regression equation using one independent variable and one dependent variable. For data collected from a sample, there is also a need to calculate the probability of the regression coefficient having occurred by chance alone. See also multiple regression analysis, regression coefficient, regression equation.
regression coefficient
Number between 0 and +1 that enables the strength of the relationship between a numerical dependent variable and a numerical independent variable to be assessed. The coefficient represents the proportion of the variation in the dependent variable that can be explained statistically by the independent variable. A value of 1 means that all the variation in the dependent variable can be explained statistically by the independent variable. A value of 0 means that none of the variation in the dependent variable can be explained by the independent variable. See also regression analysis.
regression equation
Equation used to predict the values of a dependent variable given the values of one or more independent variables. The associated regression coefficient provides an indication of how good a predictor the regression equation is likely to be. See regression coefficient.
regulatory perspective
A perspective that seeks to explain the way in which organisational affairs are regulated and offer suggestions as to how they may be improved within the framework of the way things are done at present.
relevance tree
Technique for generating research topics that starts with a broad concept from which further (usually more specific) topics are generated. Each of these topics forms a separate branch, from which further sub-branches that are more detailed can be generated.
reliability
The extent to which data collection technique or techniques will yield consistent findings, similar observations would be made or conclusions reached by other researchers or there is transparency in how sense was made from the raw data.
representative sample
Sample that represents exactly the population from which it is drawn.
representative sampling
Selection of sampling techniques in which the chance, or probability, of each case being selected from the population is known and is not zero.
research
The systematic collection and interpretation of information with a clear purpose, to find things out. See also applied research, basic research.
research approach
General term for inductive or deductive research approach. See also deductive approach, inductive approach.
research ethics
The appropriateness of the researcher’s behaviour in relation to the rights of those who become the subject of a research project, or who are affected by it. See also code of ethics, privacy, research ethics committee.
research ethics committee
Learned committee established to produce a code of research ethics, examine and approve or veto research proposals and advise in relation to the ethical dilemmas facing researchers during the conduct and reporting of research projects. See also code of ethics.
research idea
Initial idea that may be worked up into a research project.
research objectives
Clear, specific statements that identify what the researcher wishes to accomplish as a result of doing the research.
research philosophy
Overarching term relating to the development of knowledge and the nature of that knowledge in relation to research.
research population
Set of cases or group members that you are researching.
research question
One of a number of key questions that the research process will address. These are often the precursor of research objectives.
research strategy
General plan of how the researcher will go about answering the research question(s).
respondent
The person who answers the questions usually either in an interview or on a questionnaire. See also participant.
respondent interview
Interview directed by the questions posed by the interviewer, to which the interviewee responds. See also participant interview.
response bias
Attempt by an interviewee to construct an account that hides some data or when she or he presents herself or himself in a socially desirable role or situation.
response rate
The total number of responses divided by the total number in the sample after ineligible and unreachable respondents have been excluded. See ineligible respondent, unreachable respondent.
review article
Article, normally published in a refereed academic journal, that contains both a considered review of the state of knowledge in a given topic area and pointers towards areas where further research needs to be undertaken. See also refereed academic journal.
review question
Specific question you ask of the material you are reading, which is linked either directly or indirectly to your research question. See also research question.
Sub-group or part of a larger population.
sampling fraction
The proportion of the total population selected for a probability sample.
sampling error
The discrepancy, or amount of error, that exists between a sample statistic and the corresponding population parameter.
sampling frame
The complete list of all the cases in the population, from which a probability sample is drawn.
saturation
The stage when any additional data collected provides few, if any, new insights.
scale
Measure of a concept, such as customer loyalty or organisational commitment, created by combining scores to a number of rating questions. Can be constructed using nominal, interval, ordinal or ratio data.
scale item
Rating question used in combination with other rating questions to create a scale. See rating question, scale.
scale question
Closed question in which a scaling device is used to record the respondent’s response. See also Likert-type rating scale, numeric rating scale, semantic differential rating scale.
scatter graph
Diagram for showing the relationship between two numerical or ranked data variables. See also scatter plot.
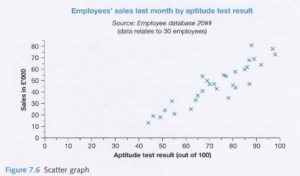
scatter plot
Diagram for showing the relationship between two numerical or ranked data variables. See also scatter graph.
scientific model
A representation of a real-world system, process, or event that helps scientists understand, predict, and visualise it.
scientific research
Research that involves the systematic observation of and experiment with phenomena.
search engine
Automated software that searches an index of documents on the Internet using key words and Boolean logic.
search string
Combination of key words used in searching online databases.
secondary analysis
The re-analysis of data for the purpose of answering the original research question with better statistical techniques, or answering new questions with old data (Glass, 1978, p. 3).
secondary data
Data used for a research project that was originally collected for some other purpose. Examples are government publications, company reports, journal articles. See also documentary secondary data, multiple source secondary data, survey-based secondary data.
secondary literature
Subsequent publication of primary literature such as books and journals.
secondary observation
Statement made by an observer of what happened or was said. By necessity this involves that observer’s interpretations.
secondary research
Following Brown (1988), one of the two ways of finding answers to questions: By looking at what other people have said about a particular issue; this is usually called ‘secondary’, ‘conceptual’, or ‘library’ research and it is an essential form of inquiry because it would be a waste of time and energy to ignore other people’s work and ‘reinvent the wheel’ again and again. (Dörnyei, 2007, pp. 15-16). See primary research.
selective coding
The process of integrating categories to produce theory in grounded theory.
self-administered questionnaire
Data collection technique in which each respondent reads and answers the same set of questions in a predetermined order without an interviewer being present.
self-coded question
Question each respondent codes her or himself as part of the process of recording their answer.
self-selection sampling
Non-probability sampling procedure in which the case, usually an individual, is allowed to identify their desire to be part of the sample.
semantic differential rating scale
Rating scale that allows the respondent to indicate his or her attitude to a concept defined by opposite adjectives or phrases.
semi-structured interview
Wide-ranging category of interview in which the interviewer commences with a set of interview themes but is prepared to vary the order in which questions are asked and to ask new questions in the context of the research situation.
sensitive personal data
Category of data, defined in law, that refers to certain specified characteristics or beliefs relating to identified or identifiable persons.
serial correlation
The extent to which the value of a variable at a particular time (t) is related to its value at the previous time period (t − 1).
shadowing
Process that the researcher would follow in order to gain a better understanding of the research context. This might involve following employees who are likely to be important in the research.
significance testing
Testing the probability of a pattern such as a relationship between two variables occurring by chance alone.
simple random sampling
Probability sampling procedure that ensures that each case in the population has an equal chance of being included in the sample.
skewness
A statistical measure that describes the degree of asymmetry observed in a distribution of data.
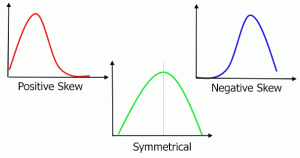
snowball sampling
Non-probability sampling procedure in which subsequent respondents are obtained from information provided by initial respondents.
social constructionism
Research philosophy that views the social world as being socially constructed.
social norm
The type of behaviour that a person ought to adopt in a particular situation.
socially desirable response
Answer given by a respondent due to her or his desire, either conscious or unconscious, to gain prestige or appear in a different social role.
source questionnaire
The questionnaire that is to be translated from when translating a questionnaire.
Spearman’s rank correlation coefficient
Statistical test that assesses the strength of the relationship between two ranked data variables. For data collected from a sample, there is also a need to calculate the probability of the correlation coefficient having occurred by chance alone.
stacked bar chart
Diagram for comparing totals and subtotals for all types of data variable.
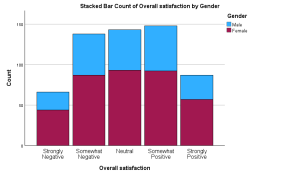
standard deviation
Statistic that describes the extent of spread of data values around the mean for a variable containing numerical data.
statistic
A value, usually a numerical value, that describes a sample. It may be obtained from a single measurement, or it may be derived from a set of measurements from the sample. See parameter.
statistical inference
The process of coming to conclusions about the population on the basis of data describing a sample drawn from that population.
statistical significance
The likelihood of the pattern that is observed (or one more extreme) occurring by chance alone, if there really was no difference in the population from that which the sample was drawn.
statistics
Refers to a set of procedures and rules for organising, summarising, and interpreting information.
These procedures help ensure that the information or observations are presented and interpreted in an accurate und informative way. In somewhat grandiose terms, these procedures help researchers bring order out of chaos. In addition, they provide researchers with a set of standardised techniques that are recognised and understood throughout the scientific community. Thus, the method used by one researcher will be familiar to other researchers, who can accurately interpret the analyses with a full understanding of how the analysis was done and what the results signify. (Gravetter & Wallnau, 1996, p. 3).
storyline
The way in which the reader is led through the research project to the main conclusion or the answer to the research question. The storyline is, in effect, a clear theme that runs through the whole of the project report to convey a coherent and consistent message.
stratified random sampling
Probability sampling procedure in which the population is divided into two or more relevant strata and a random sample (systematic or simple) is drawn from each of the strata.
structural equation modelling (SEM)
Structural Equation Modelling (SEM) is a comprehensive multivariate statistical technique used to test complex relationships between observed variables and unobserved (latent) constructs. It integrates factor analysis and multiple regression to evaluate direct and indirect effects, effectively correcting for measurement error.
structured interview
Data collection technique in which an interviewer physically meets the respondent, reads them the same set of questions in a predetermined order, and records his or her response to each.
structured methodology
Data collection methods that are easily replicated (such as the use of an observation schedule or questionnaire) to ensure high reliability.
subject directory
Hierarchically organised index categorised into broad topics, which, as it has been compiled by people, is likely to have its content partly censored and evaluated.
subject or participant bias
Bias that may occur when research subjects are giving inaccurate responses in order to distort the results of the research.
subject or participant error
Errors that may occur when research subjects are studied in situations that are inconsistent with their normal behaviour patterns, leading to atypical responses.
subjectivism
An ontological position that asserts that entities are created from the perceptions and consequent actions of those social actors responsible for their creation. See also ontology, objectivism.
survey
Research strategy that involves the structured collection of data from a sizeable population. Although the term ‘survey’ is often used to describe the collection of data using questionnaires, it includes other techniques such as structured observation and structured interviews.
survey-based secondary data
Data collected by surveys, such as by questionnaire, which have already been analysed for their original purpose.
symbolic interactionism
Social process through which the individual derives a sense of identity from interaction and communication with others. Through this process of interaction and communication the individual responds to others and adjusts his or her understandings and behaviour as a shared sense of order and reality is ‘negotiated’ with others.
symmetric distribution
Description of the distribution of data for a variable in which the data are distributed equally either side of the highest frequency.
symmetry of potential outcomes
Situation in which the results of the research will be of similar value whatever they are.
synchronous
Undertaken in real time, occurring at the same time.
synthesis
Process of arranging and assembling various elements so as to make a new statement, or conclusion.
systematic review
A process for reviewing the literature using a comprehensive pre-planned search strategy. There are clear assessment criteria for selection of articles to review, articles are assessed on the quality of research and findings, individual studies are synthesised using a clear framework and findings presented in a balanced, impartial and comprehensive manner.
systematic sampling
Probability sampling procedure in which the initial sampling point is selected at random, and then the cases are selected at regular intervals.
Technique for summarising data from one or more variables so that specific values can be read. See also contingency table, frequency distribution.
tailored design method
Approach to designing questionnaires specifying precisely how to construct and use them; previously referred to as the ‘total design method’.
tally
A measure of how many, for example, people fit into a category. See Frequency Count.
target questionnaire
The translated questionnaire when translating from a source questionnaire.
teleological view
View that the ends served by research justify the means. Consequently, the benefits of research findings are weighed against the costs of acting unethically.
telephone questionnaire
Data collection technique in which an interviewer contacts the respondent and administers the questionnaire using a telephone. The interviewer reads the same set of questions to the respondent in a predetermined order and records his or her responses.
template analysis
Analysis of qualitative data that involves creating and developing a hierarchical template of data codes or categories representing themes revealed in the data collected and the relationships between these.
tertiary literature source
Source designed to help locate primary and secondary literature, such as an index, abstract, encyclopaedia or bibliography.
theory
A well-substantiated explanation of an aspect of the natural or social world that is grounded in facts, evidence, and tested hypotheses. It is developed through a systematic process of observation and reasoning and serves to organize knowledge into coherent frameworks.
theory dependent
If we accept that every purposive decision we take is based on the assumption that certain consequences will flow from the decision, then these decisions are theory dependent.
thesis
The usual name for research projects undertaken for Master of Philosophy (MPhil) and Doctor of Philosophy (PhD) degrees, written for an academic audience.
time error
Error, usually associated with structured observations, where the time at which the observation is being conducted provides data that are untypical of the time period in which the event(s) being studied would normally occur.
time series
Set of numerical data values recorded for a single variable over time usually at regular intervals. See also moving average.
trait
A trait is a distinguishing characteristic, quality, or behavioral tendency that defines a person, organism, or thing. It represents an identifiable feature that makes something unique or recognizable.
transcription
The written record of what a participant (or respondent) said in response to a question, or what participants (or respondents) said to one another in conversation, in their own words.
triangulation
The use of two or more independent sources of data or data-collection methods within one study in order to help ensure that the data are telling you what you think they are telling you.
t-test
Statistical test to determine the probability (likelihood) that the values of a numerical data variable for two independent samples or groups are different. The test assesses the likelihood of any difference between these two groups occurring by chance alone. See also paired t-test.
type I error
Error made by wrongly coming to the decision that something is true when in reality it is not. See type II error.
type II error
Error made by wrongly coming to the decision that something is not true when in reality it is.
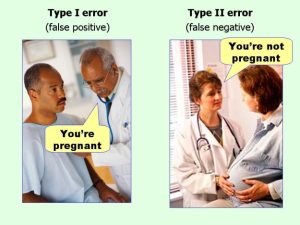
typical case sampling
A purposive sampling method which focuses on selecting those cases on the basis that they are typical or illustrative. See also purposive sampling.
Tendency for a respondent to deliberately guess where they have sufficient knowledge or experience to answer a question.
unitising data
The process of attaching relevant ‘bits’ or ‘chunks’ of your data to the appropriate category or categories that you have devised.
unit of data
A number of words, a line of a transcript, a sentence, a number of sentences, a complete paragraph, or some other chunk of textual data that fits the category.
unreachable respondent
Respondent selected for a sample who cannot be located or who cannot be contacted.
unstructured interview
Loosely structured and informally conducted interview that may commence with one or more themes to explore with participants but without a predetermined list of questions to work through. See also informant interview.
upper quartile
The value above which a quarter of the data values lie when the data values for a variable have been ranked.
The extent to which data collection method or methods accurately measure what they were intended to measure. See also construct validity, criterion related validity, ecological validity, face validity, internal validity, measurement validity, predictive validity.
variable
Individual element or attribute upon which data have been collected that changes or has different values for different individuals. See independent variable, dependent variable,.confounding variable.
variance
Statistic that measures the spread of data values; a measure of dispersion. The smaller the variance, the closer individual data values are to the mean. The value of the variance is the square root of the standard deviation. See also dispersion measures, standard deviation.
variance inflation factor (VIF)
Statistic used to measure collinearity. See collinearity.
visual aid
Item such as an overhead projector slide, whiteboard, video recording or handout that is designed to enhance professional presentation and the learning of the audience.
Usually refers to a written account of a mixture of what is happening in a person’s life and what is happening on the Internet, published on the Internet.
weighting
The process by which data values are adjusted to reflect differences in the proportion of the population that each case represents.
